First News App
A step-by-step guide to publishing a simple news application.
This tutorial will walk you through the process of building an interactive data visualization from a structured dataset. You will get hands-on experience in every stage of the development process, writing Python, HTML and JavaScript while recording it in Git’s version control system. By the end you will have published your work on the World Wide Web.
What you will make
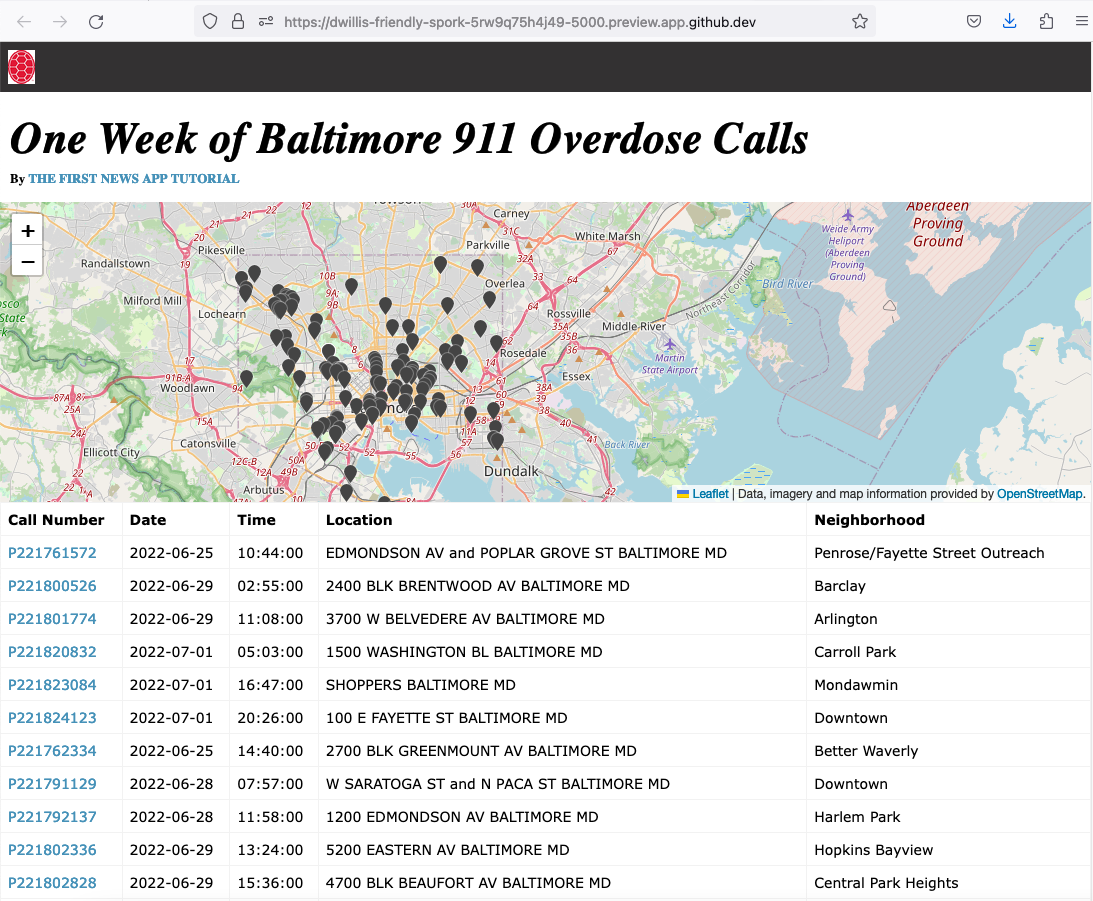
By the end of this lesson, you will publish an interactive database and map of one week’s worth of 911 calls reporting overdoses in Baltimore City from 2022. You will do this with an improved version of the 911 call data that
A working example of what you’ll make can be found at https://newsappsumd.github.io/first-news-app-dwillis/build/index.html
Past students of this tutorial have gone on to use the skills they learned to create projects like The Chicago Reporter’s police complaints database, the Naples Daily News’ greyhound dogs death database and the San Antonio Express-News’ homicide database.
Prelude: Prerequisites
Before you can begin, your computer needs the following tools installed and working.
An account at GitHub.com
A browser. That’s it! (We’ll be using GitHub’s Codespaces.)
Act 1: Hello Codespaces
Start at the GitHub URL for this repository
Click the green “Use this template” button and choose “Open in a codespace”. You should see something like this:
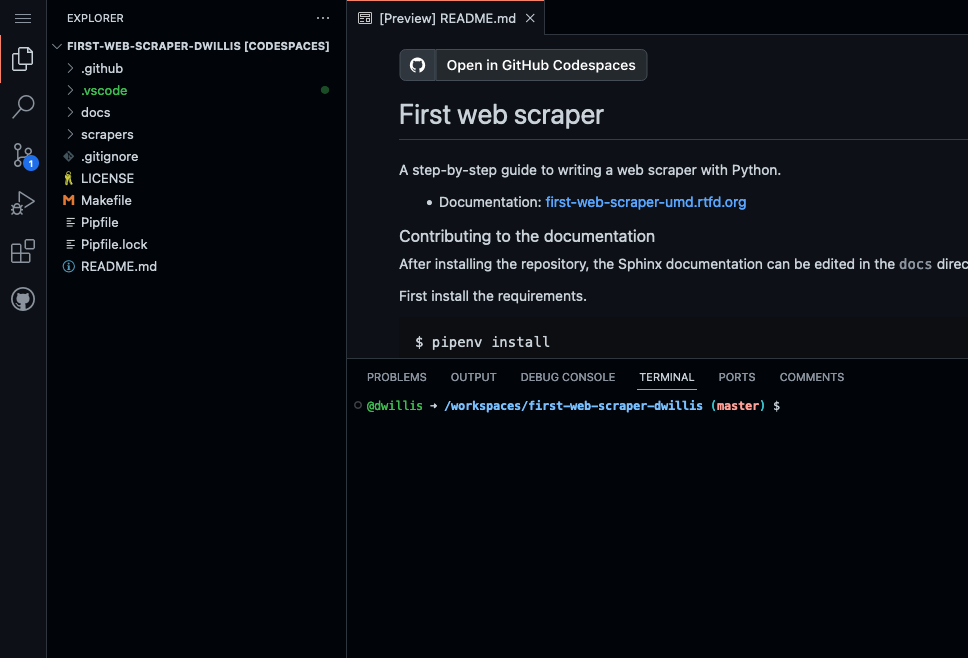
The browser is divided into three sections: on the left is a file explorer, listing all of the files in this repository. The top right shows whatever file you’re currently viewing or editing, defaulting to README.md. The bottom right shows the terminal, where we’ll run commands.
The codespace will be connected to your repository in the the NewsApps organization on GitHub.
Open up the README by clicking on README.md on the left side and type something in it. Maybe change the heading like:
# My First Web News App
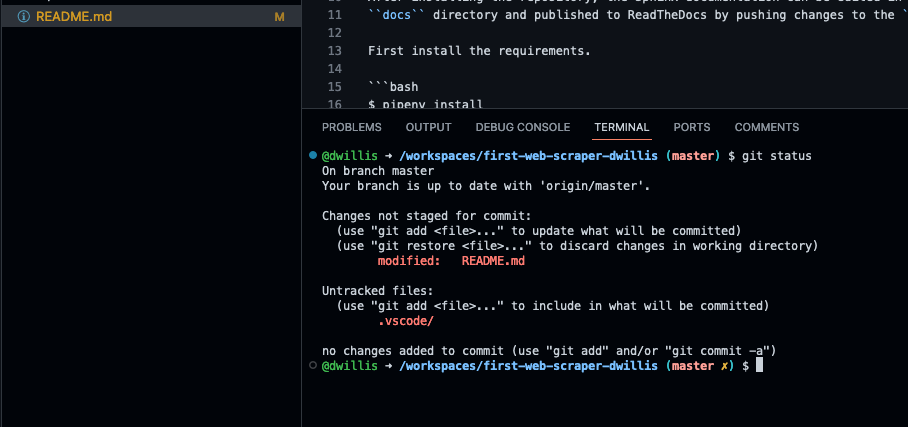
Make sure to save it. You’ll see on the left that there’s a yellow “M” next to README.md, meaning you’ve made some edits. Let’s double-check that in the terminal:
$ git status
You should see something like this:
If so, we can add and commit it:
$ git add README.md
Log its creation with Git’s commit command. You can include a personalized message after the -m flag.
$ git commit -m "First commit"
Now, finally, push your commit up to GitHub.
$ git push origin main
Reload your repository on GitHub and see your handiwork.
Act 2: Hello Flask
Use pip on the command line to install Flask, the Python “microframework” we’ll use to put together our website.
$ pip install Flask
Create a new file called app.py where we will configure Flask.
# in the terminal:
$ touch app.py
Open app.py with your code editor and import the Flask basics. This is the file that will serve as your
application’s “backend,” routing data to the appropriate pages.
from flask import Flask
app = Flask(__name__)  # Note the double underscores on each side!
Next we will configure Flask to make a page at your site’s root URL.
Configure Flask to boot up a test server when you run app.py like so:
from flask import Flask
app = Flask(__name__)

if __name__ == '__main__':
    # Fire up the Flask test server
    app.run(debug=True, use_reloader=True)
Note
You’re probably asking, “What the heck is if __name__ == '__main__'?” The short answer: It’s just one of the weird things in Python you have to memorize. But it’s worth the brain space because it allows you to run any Python script as a program.
Anything indented inside that particular if clause is executed when the script is called from the command line. In this case, that means booting up your web site using Flask’s built-in app.run function.
Don’t forget to save your changes. Then run app.py on the command-line and open up your browser to localhost:5000
$ python app.py
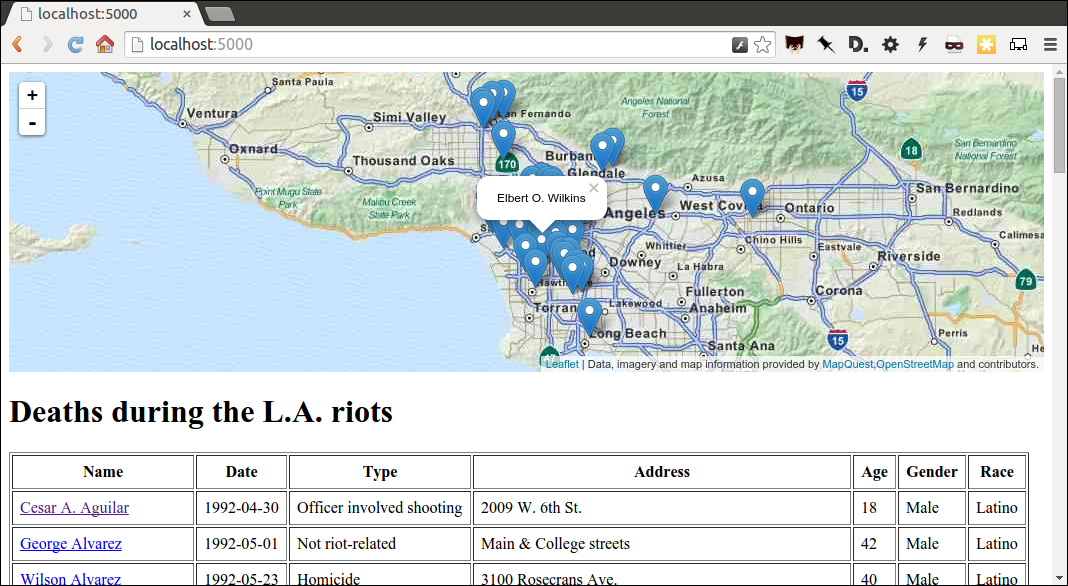
Here’s what you should see. A website with nothing to show.
Next we’ll put a page there. Our goal is to publish the complete list of people who died during the riots using a template. We will call that template “index.html”.
Before we do that, return to your command-line interface and stop your webserver by hitting the combination of CTRL-C. You should now again at the standard command-line interface.
Now in app.py import render_template, a Flask function we can use to combine data with HTML to make a webpage.
from flask import Flask
from flask import render_template
app = Flask(__name__)

if __name__ == '__main__':
    # Fire up the Flask test server
    app.run(debug=True, use_reloader=True)
Then create a function called index that returns our rendered index.html template.
from flask import Flask
from flask import render_template
app = Flask(__name__)

def index():
    template = 'index.html'
    return render_template(template)

if __name__ == '__main__':
    # Fire up the Flask test server
    app.run(debug=True, use_reloader=True)
Now use one of Flask’s coolest tricks, the app.route decorator, to connect that function with the root URL of our site, /.
from flask import Flask
from flask import render_template
app = Flask(__name__)

@app.route("/")
def index():
    template = 'index.html'
    return render_template(template)

if __name__ == '__main__':
    # Fire up the Flask test server
    app.run(debug=True, use_reloader=True)
Return to your command line and create a directory to store your templates in the default location Flask expects.
$ mkdir templates
Next create the index.html file we referenced in app.py. This is the HTML file where your will lay out your webpage.
$ touch templates/index.html
Open it up in your text editor and write something clever.
Hello World!
Now restart your Flask server.
$ python app.py
Head back to your browser and visit your site again. You should see the contents of your template displayed on the page.
We’re approaching the end of this act, so it’s time to save your work by returning to the command line and committing these changes to your Git repository.
Note
To get the terminal back up, you will either need to quit out of app.py by hitting CTRL-C, or open a second terminal and do additional work there. If you elect to open a second terminal, which is recommended, make sure to check into the virtualenv by repeating the . bin/activate part of activate. If you choose to quit out of app.py, you will need to turn it back on later by calling python app.py where appropriate.
As we progress through this lesson, you will need to continually do this to switch between the server and terminal. We no longer be instructing to do it each time from here on.
I bet you remember how from above. But here’s a reminder.
$ git add . # Using "." is a trick that will quickly stage *all* files you've changed.
$ git commit -m "Flask app.py and first template"
Push it up to GitHub and check out the changes there.
$ git push origin main
Congratulations, you’ve made a real web page with Flask. Now to put something useful in it.
Act 3: Hello HTML
Start over in your templates/index.html file with a bare-bones HTML document.
<!doctype html>
<html lang="en">
    <head></head>
    <body>
        <h1>One Week of Baltimore 911 Overdose Calls</h1>
    </body>
</html>
Commit the changes to your repository, if only for practice.
$ git add templates/index.html
$ git commit -m "Real HTML"
$ git push origin main
Make a directory to store our data file.
$ mkdir static
Download the comma-delimited file that will be the backbone of our application and save it there as balt911.csv. Add it to your git repository.
$ git add static
$ git commit -m "Added CSV source data"
$ git push origin main
Next we will open up app.py in your text editor and create a function that uses Python’s csv module to access the data.
First, create the new function and give it the path to your CSV file.
import csv
from flask import Flask
from flask import render_template
app = Flask(__name__)

def get_csv():
    csv_path = './static/balt911.csv'

@app.route("/")
def index():
    template = 'index.html'
    return render_template(template)

if __name__ == '__main__':
    app.run(debug=True, use_reloader=True)
Open up the file path for reading with Python using the built-in open function.
import csv
from flask import Flask
from flask import render_template
app = Flask(__name__)

def get_csv():
    csv_path = './static/balt911.csv'
    csv_file = open(csv_path, 'rb')

@app.route("/")
def index():
    template = 'index.html'
    return render_template(template)

if __name__ == '__main__':
    app.run(debug=True, use_reloader=True)
Pass it into the csv module’s DictReader, to be parsed and returned as a list of dictionaries.
import csv
from flask import Flask
from flask import render_template
app = Flask(__name__)

def get_csv():
    csv_path = './static/balt911.csv'
    csv_file = open(csv_path, 'rb')
    csv_obj = csv.DictReader(csv_file)

@app.route("/")
def index():
    template = 'index.html'
    return render_template(template)

if __name__ == '__main__':
    app.run(debug=True, use_reloader=True)
Note
Don’t know what a dictionary is? That’s okay. You can read more about them here but the minimum you need to know now is that they are Python’s way of handling each row in your CSV. The columns there, like callNumber or location, are translated into “keys” on dictionary objects that you can access like row['id'].
A quirk of CSV objects is that once they’re used they disappear. There’s a good reason related to efficiency and memory limitations and all that but we won’t bother with that here. Just take our word and use Python’s built-in list function to convert this one to a permanent list.
import csv
from flask import Flask
from flask import render_template
app = Flask(__name__)

def get_csv():
    csv_path = './static/balt911.csv'
    csv_file = open(csv_path, 'rb')
    csv_obj = csv.DictReader(csv_file)
    csv_list = list(csv_obj)

@app.route("/")
def index():
    template = 'index.html'
    return render_template(template)

if __name__ == '__main__':
    app.run(debug=True, use_reloader=True)
Close the function by returning the csv list.
import csv
from flask import Flask
from flask import render_template
app = Flask(__name__)

def get_csv():
    csv_path = './static/balt911.csv'
    csv_file = open(csv_path, 'rb')
    csv_obj = csv.DictReader(csv_file)
    csv_list = list(csv_obj)
    return csv_list

@app.route("/")
def index():
    template = 'index.html'
    return render_template(template)

if __name__ == '__main__':
    app.run(debug=True, use_reloader=True)
Next have your index function pull the CSV data using your new code and pass it on the top the template, where it will be named object_list.
import csv
from flask import Flask
from flask import render_template
app = Flask(__name__)

def get_csv():
    csv_path = './static/balt911.csv'
    csv_file = open(csv_path, 'r')
    csv_obj = csv.DictReader(csv_file)
    csv_list = list(csv_obj)
    return csv_list

@app.route("/")
def index():
    template = 'index.html'
    object_list = get_csv()
    return render_template(template, object_list=object_list)

if __name__ == '__main__':
    app.run(debug=True, use_reloader=True)
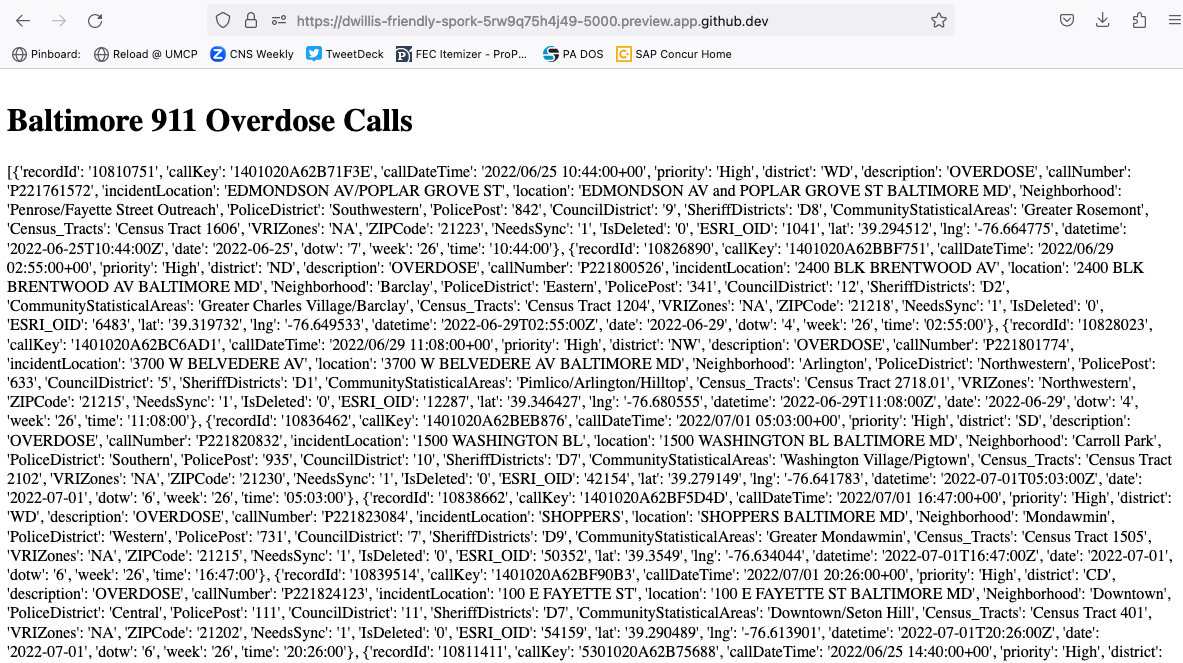
Make sure to save app.py. Then return to the index.html template. There you can dump out the object_list data using Flask’s templating language Jinja.
<!doctype html>
<html lang="en">
    <head></head>
    <body>
        <h1>One Week of Baltimore 911 Overdose Calls</h1>
        {{ object_list }}
    </body>
</html>
If it isn’t already running, return the command line, restart your test server and visit localhost:5000 again.
$ python app.py
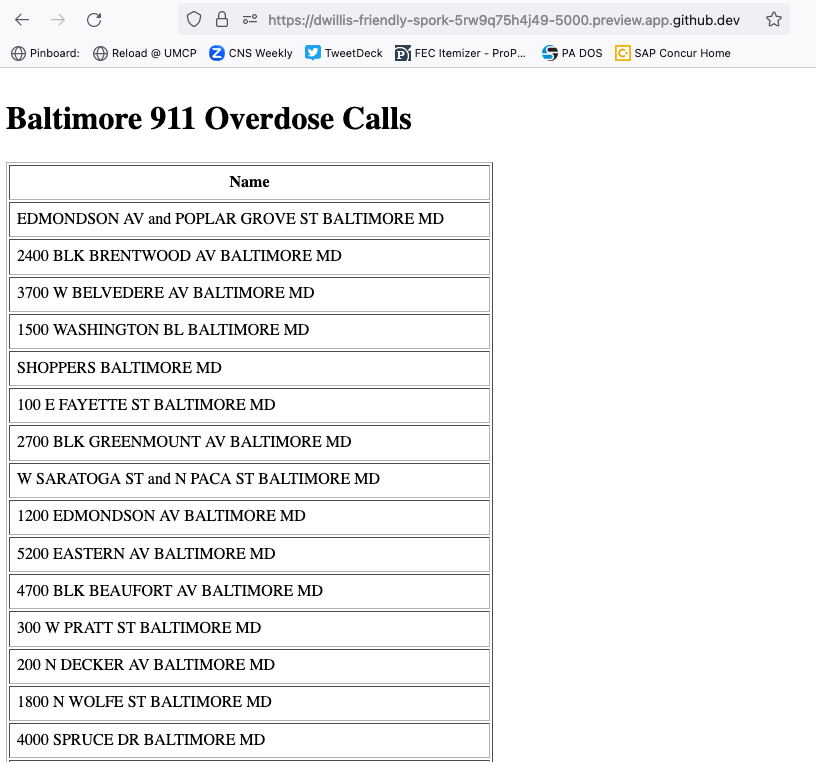
Now we’ll use Jinja to sculpt the data in index.html to create an HTML table that lists all the names. Flask’s templating language allows us to loop through the data list and print out a row for each record.
<!doctype html>
<html lang="en">
    <head></head>
    <body>
        <h1>One Week of Baltimore 911 Overdose Calls</h1>
        <table border=1 cellpadding=7>
            <tr>
                <th>Name</th>
            </tr>
            {% for obj in object_list %}
            <tr>
                <td>{{ obj.location }}</td>
            </tr>
            {% endfor %}
        </table>
    </body>
</html>
Pause to reload your browser page.
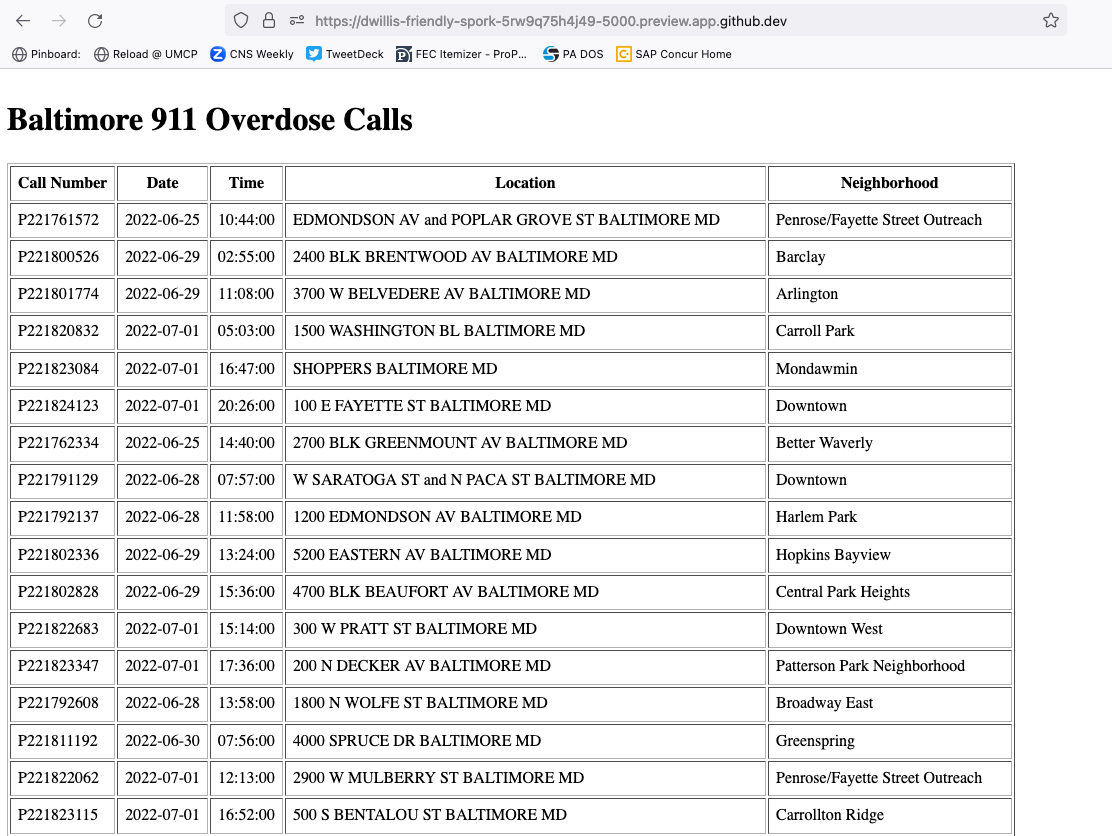
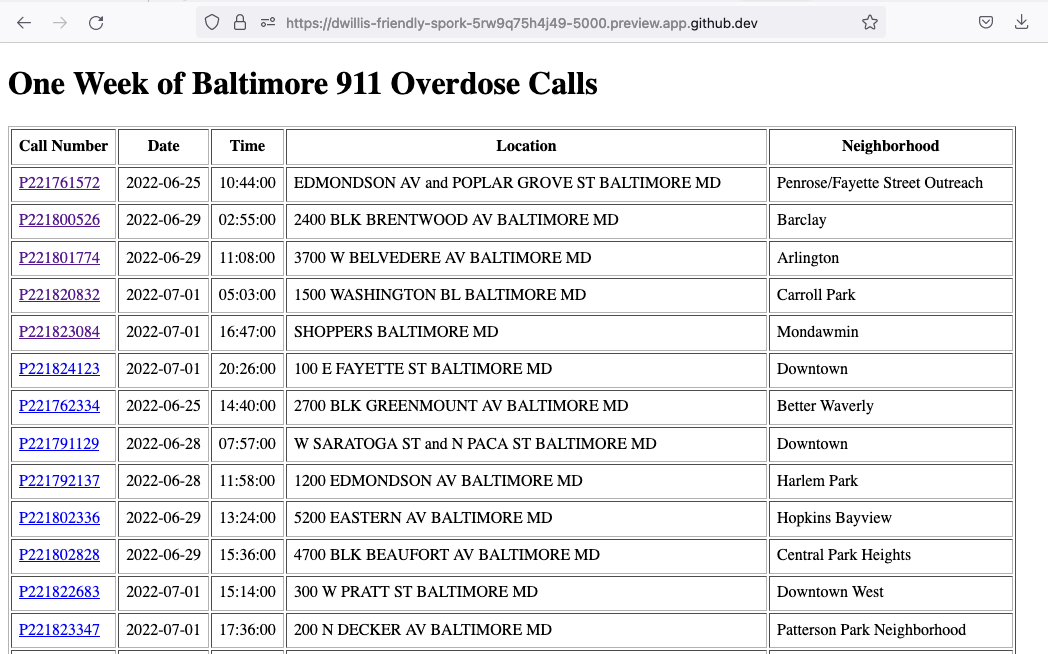
Next expand the table to include a lot more data.
<!doctype html>
<html lang="en">
    <head></head>
    <body>
        <h1>One Week of Baltimore 911 Overdose Calls</h1>
        <table border=1 cellpadding=7>
            <tr>
                <th>Call Number</th>
                <th>Date</th>
                <th>Time</th>
                <th>Location</th>
                <th>Neighborhood</th>
            </tr>
            {% for obj in object_list %}
            <tr>
                <td>{{ obj.callNumber }}</td>
                <td>{{ obj.date }}</td>
                <td>{{ obj.time }}</td>
                <td>{{ obj.location }}</td>
                <td>{{ obj.Neighborhood }}</td>
            </tr>
            {% endfor %}
        </table>
    </body>
</html>
Reload your page in the browser again to see the change.
Then commit your work.
$ git add .
$ git commit -m "Created basic table"
$ git push origin main
Next we’re going to create a unique “detail” page dedicated to each person. Start by returning to app.py in your text editor and adding the URL and template that will help make this happen.
import csv
from flask import Flask
from flask import render_template
app = Flask(__name__)

def get_csv():
    csv_path = './static/balt911.csv'
    csv_file = open(csv_path, 'r')
    csv_obj = csv.DictReader(csv_file)
    csv_list = list(csv_obj)
    return csv_list

@app.route("/")
def index():
    template = 'index.html'
    object_list = get_csv()
    return render_template(template, object_list=object_list)

@app.route('/<call_number>/')
def detail(call_number):
    template = 'detail.html'
    return render_template(template, call_number=call_number)

if __name__ == '__main__':
    app.run(debug=True, use_reloader=True)
Note
Notice a key difference between the URL route for the index and the one we just added. This time, both the URL route and function accept an argument, named call_number. Our goal is for the number passed into the URL to go into the function where it can be used to pull the record with the corresponding id from the CSV. Once we have our hands on it, we can pass it on to the template to render its unique page.
Create a new file in your templates directory called detail.html for it to connect with.
# in the terminal:
$ touch templates/detail.html
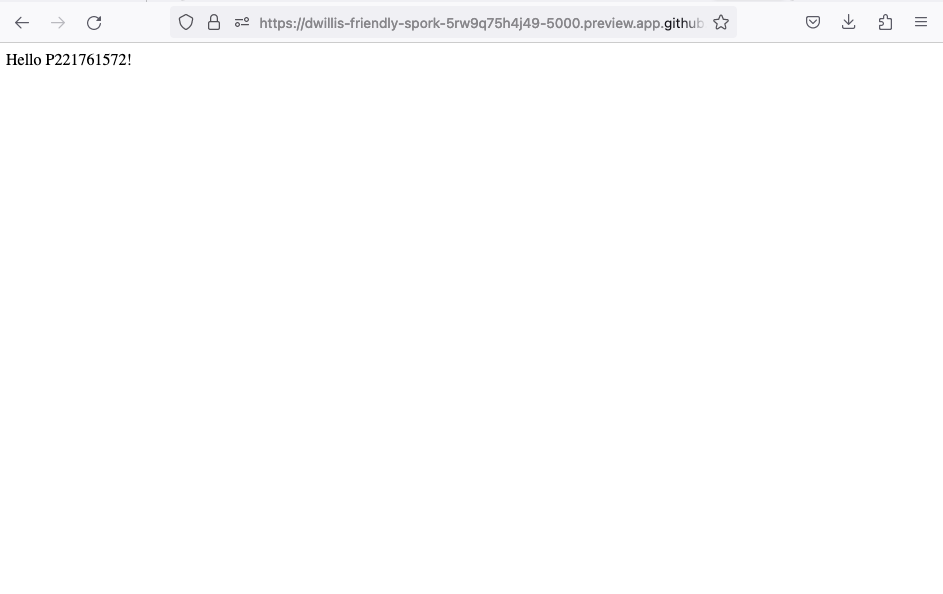
Put something simple in it with your text editor. We’ll use the same templating language as above to print out the row id for each page.he
Hello {{ call_number }}!
Then, if it’s not running, restart your test server and use your browser to visit localhost:5000/P221761572/.
$ python app.py
To customize the page for each person, we will need to connect the call_number in the URL with the callNumber column in the CSV data file.
First, return to app.py and pull the CSV data into the detail view.
import csv
from flask import Flask
from flask import render_template
app = Flask(__name__)

def get_csv():
    csv_path = './static/balt911.csv'
    csv_file = open(csv_path, 'r')
    csv_obj = csv.DictReader(csv_file)
    csv_list = list(csv_obj)
    return csv_list

@app.route("/")
def index():
    template = 'index.html'
    object_list = get_csv()
    return render_template(template, object_list=object_list)

@app.route('/<call_number>/')
def detail(call_number):
    template = 'detail.html'
    object_list = get_csv()
    return render_template(template, call_number=call_number)

if __name__ == '__main__':
    app.run(debug=True, use_reloader=True)
Then have the detail function loop through the CSV data list, testing each row’s callNumber field against the call_number provided by the URL. When you find a match, pass that row out to the template for rendering with the name object.
import csv
from flask import Flask
from flask import render_template
app = Flask(__name__)

def get_csv():
    csv_path = './static/balt911.csv'
    csv_file = open(csv_path, 'r')
    csv_obj = csv.DictReader(csv_file)
    csv_list = list(csv_obj)
    return csv_list

@app.route("/")
def index():
    template = 'index.html'
    object_list = get_csv()
    return render_template(template, object_list=object_list)

@app.route('/<call_number>/')
def detail(call_number):
    template = 'detail.html'
    object_list = get_csv()
    for row in object_list:
        if row['callNumber'] == call_number:
            return render_template(template, object=row)

if __name__ == '__main__':
    app.run(debug=True, use_reloader=True)
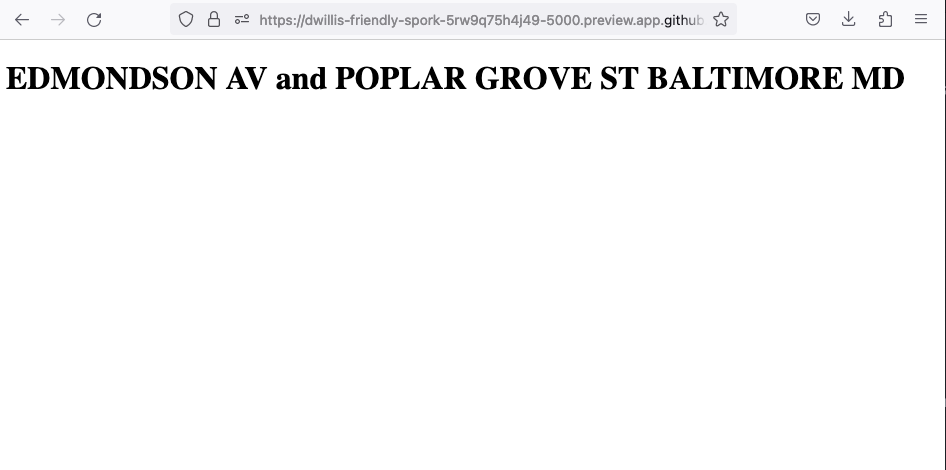
Now clear detail.html and make a new HTML document with a headline drawn from the data we’ve passed in from the dictionary.
<!doctype html>
<html lang="en">
    <head></head>
    <body>
        <h1>{{ object.location }}</h1>
    </body>
</html>
Restart your test server and take a look at http://localhost:5000/P221761572/ again.
$ python app.py
Return to index.html and add a hyperlink to each detail page to the table.
<!doctype html>
<html lang="en">
    <head></head>
    <body>
        <h1>One Week of Baltimore 911 Overdose Calls</h1>
        <table border=1 cellpadding=7>
        <tr>
            <th>Call Number</th>
            <th>Date</th>
            <th>Time</th>
            <th>Location</th>
            <th>Neighborhood</th>
        </tr>
        {% for obj in object_list %}
        <tr>
            <td><a href="{{ obj.callNumber }}/">{{ obj.callNumber }}</a></td>
            <td>{{ obj.date }}</td>
            <td>{{ obj.time }}</td>
            <td>{{ obj.location }}</td>
            <td>{{ obj.Neighborhood }}</td>
        </tr>
        {% endfor %}
        </table>
    </body>
</html>
Restart your test server and take a look at http://localhost:5000/.
$ python app.py
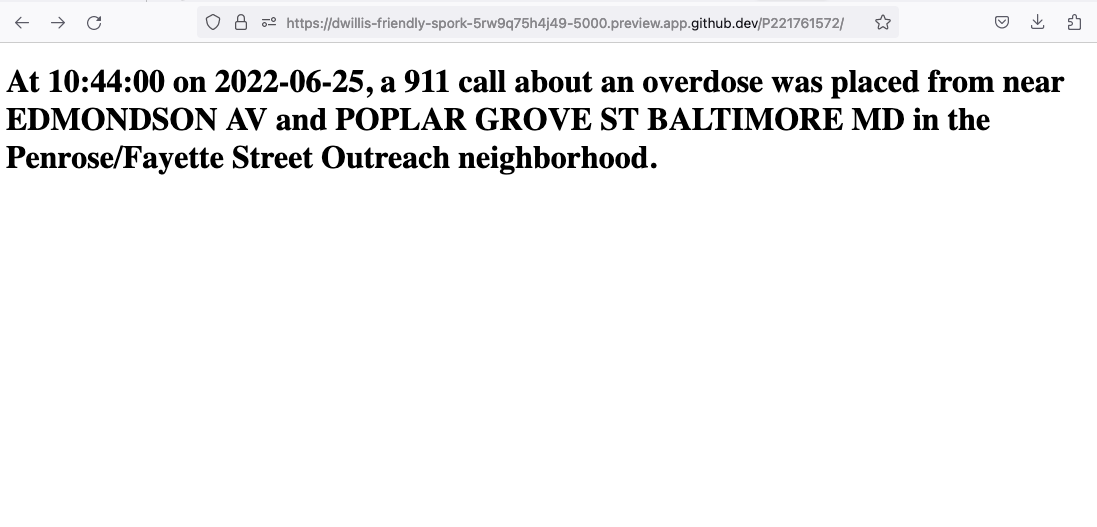
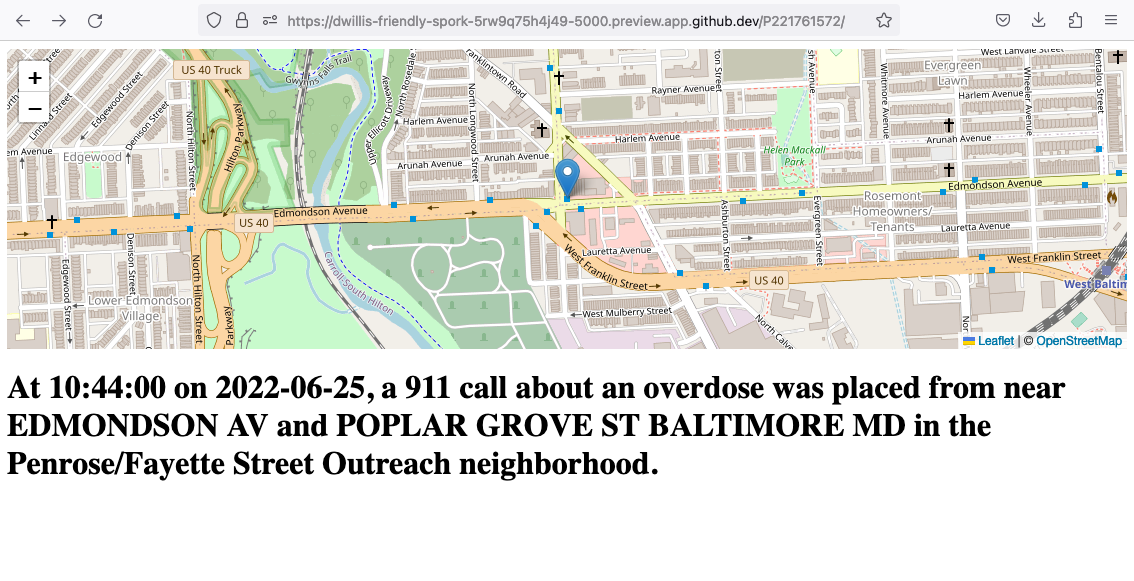
In detail.html you can use the rest of the data fields to write a sentence about the 911 call.
<!doctype html>
<html lang="en">
    <head></head>
    <body>
        <h1>
            At {{ object.time }} on {{ object.date }}, a 911 call about an overdose was placed from near
            {{ object.location }} in the {{ object.Neighborhood }} neighborhood.
        </h1>
    </body>
</html>
Reload localhost:5000/P221761572/ to see it.
Then once again commit your work.
$ git add .
$ git commit -m "Created a detail page about each call."
$ git push origin main
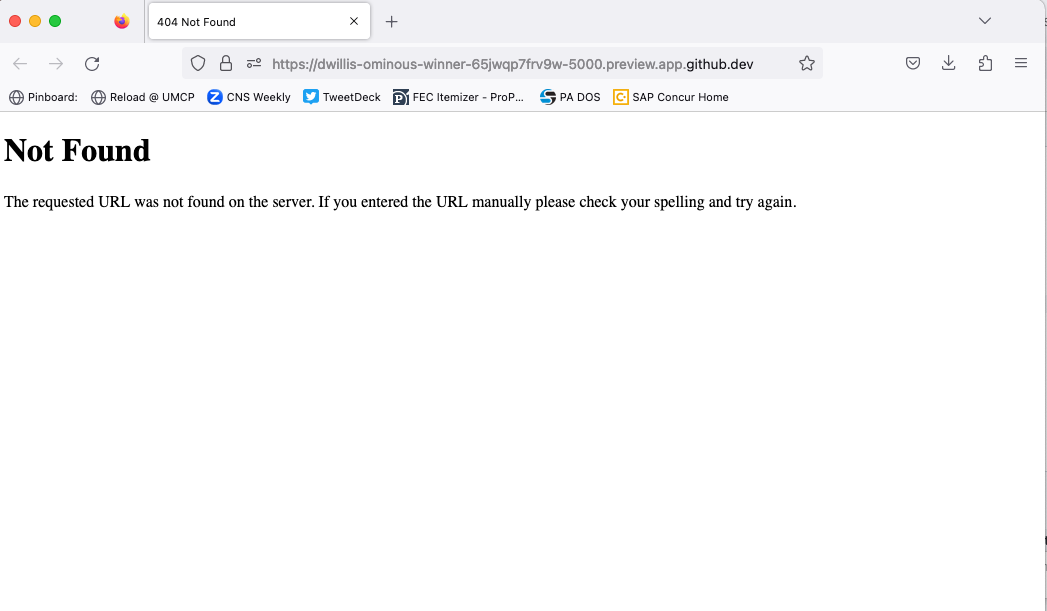
One last thing before we move on. What if somebody vists an URL for an id that doesn’t exist, like localhost:5000/99999/? Right now Flask throws an ugly error.
The polite thing to do is return what is called a 404 response code. To do that with Flask, you only need to import a function called abort and run it after our loop finishes without finding a match.
import csv
from flask import Flask
from flask import abort
from flask import render_template
app = Flask(__name__)

def get_csv():
    csv_path = './static/balt911.csv'
    csv_file = open(csv_path, 'r')
    csv_obj = csv.DictReader(csv_file)
    csv_list = list(csv_obj)
    return csv_list

@app.route("/")
def index():
    template = 'index.html'
    object_list = get_csv()
    return render_template(template, object_list=object_list)

@app.route('/<call_number>/')
def detail(call_number):
    template = 'detail.html'
    object_list = get_csv()
    for row in object_list:
        if row['callNumber'] == call_number:
            return render_template(template, object=row)
    abort(404)

if __name__ == '__main__':
    app.run(debug=True, use_reloader=True)
Reload your bad URL and you’ll see the change.
Act 4: Hello JavaScript
Now we will use the Leaflet JavaScript library to create a map on each detail page showing where the call was made. Start by importing it in your page.
<!doctype html>
<html lang="en">
    <head>
        <link rel="stylesheet" href="https://unpkg.com/leaflet@1.9.3/dist/leaflet.css"
    integrity="sha256-kLaT2GOSpHechhsozzB+flnD+zUyjE2LlfWPgU04xyI="
    crossorigin=""/>
    <script src="https://unpkg.com/leaflet@1.9.3/dist/leaflet.js"
 integrity="sha256-WBkoXOwTeyKclOHuWtc+i2uENFpDZ9YPdf5Hf+D7ewM="
 crossorigin=""></script>
    </head>
    <body>
        <h1>
            At {{ object.time }} on {{ object.date }}, a 911 call about an overdose was placed from near
            {{ object.location }} in the {{ object.Neighborhood }} neighborhood.
        </h1>
    </body>
</html>
Open up detail.html and make a map there, focus on just that call.
<!doctype html>
<html lang="en">
<head>
<link rel="stylesheet" href="https://unpkg.com/leaflet@1.9.3/dist/leaflet.css"
integrity="sha256-kLaT2GOSpHechhsozzB+flnD+zUyjE2LlfWPgU04xyI="
crossorigin=""/>
<script src="https://unpkg.com/leaflet@1.9.3/dist/leaflet.js"
integrity="sha256-WBkoXOwTeyKclOHuWtc+i2uENFpDZ9YPdf5Hf+D7ewM="
crossorigin=""></script>
</head>
<body>
<div id="map" style="width:100%; height:300px;"></div>
<h1>
At {{ object.time }} on {{ object.date }}, a 911 call about an overdose was placed from near
{{ object.location }} in the {{ object.Neighborhood }} neighborhood.
</h1>
<script type="text/javascript">
var map = L.map('map').setView([{{ object.lat }}, {{ object.lng }}], 16);
L.tileLayer('https://tile.openstreetmap.org/{z}/{x}/{y}.png', {
maxZoom: 19,
attribution: '© <a href="http://www.openstreetmap.org/copyright">OpenStreetMap</a>'
}).addTo(map);
var marker = L.marker([{{ object.lat }}, {{ object.lng }}]).addTo(map);
</script>
</body>
</html>
Reload a detail page, like the one at localhost:5000/P221761572/.
Commit that.
$ git add .
$ git commit -m "Made a map on the detail page"
$ git push origin main
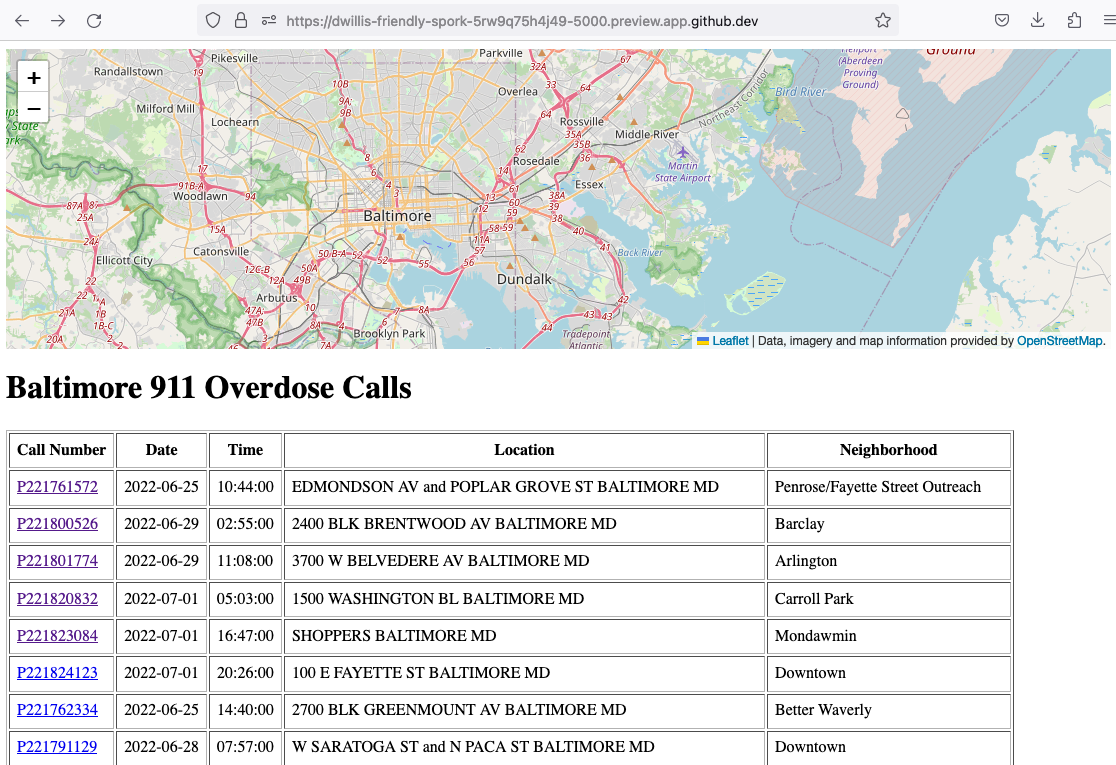
Next we will work to make a map with every call in index.html in one view.
Create an HTML element to hold the map and use Leaflet to boot it up and center on Baltimore.
<!doctype html>
<html lang="en">
<head>
<link rel="stylesheet" href="https://unpkg.com/leaflet@1.9.3/dist/leaflet.css"
integrity="sha256-kLaT2GOSpHechhsozzB+flnD+zUyjE2LlfWPgU04xyI="
crossorigin=""/>
<script src="https://unpkg.com/leaflet@1.9.3/dist/leaflet.js"
integrity="sha256-WBkoXOwTeyKclOHuWtc+i2uENFpDZ9YPdf5Hf+D7ewM="
crossorigin=""></script>
</head>
<body>
<div id="map" style="width:100%; height:300px;"></div>
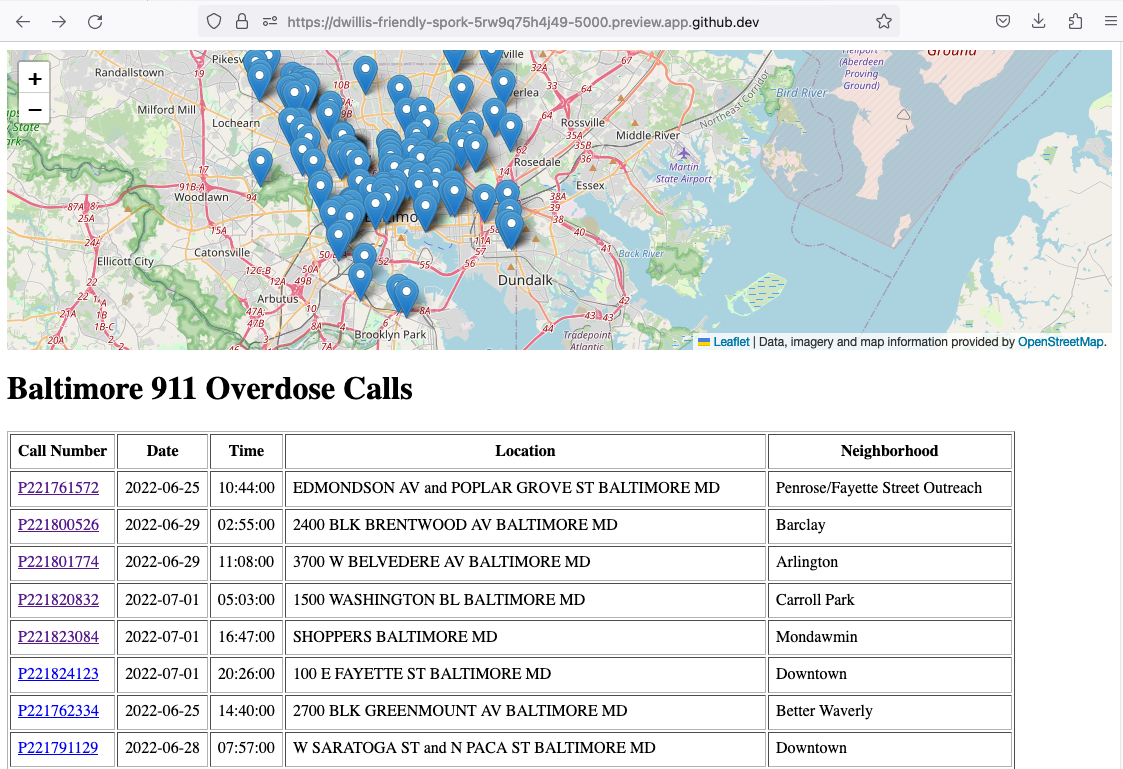
<h1>Baltimore 911 Overdose Calls</h1>
<table border=1 cellpadding=7>
<tr>
<th>Call Number</th>
<th>Date</th>
<th>Time</th>
<th>Location</th>
<th>Neighborhood</th>
</tr>
{% for obj in object_list %}
<tr>
<td><a href="{{ obj.callNumber }}/">{{ obj.callNumber }}</a></td>
<td>{{ obj.date }}</td>
<td>{{ obj.time }}</td>
<td>{{ obj.location }}</td>
<td>{{ obj.Neighborhood }}</td>
</tr>
{% endfor %}
</table>
<script type="text/javascript">
var map = L.map('map').setView([39.3, -76.5], 11);
var osmLayer = new L.TileLayer('https://{s}.tile.openstreetmap.org/{z}/{x}/{y}.png', {
maxZoom: 18,
attribution: 'Data, imagery and map information provided by <a href="https://www.openstreetmap.org/" target="_blank">OpenStreetMap</a>.'
});
map.addLayer(osmLayer);
</script>
</body>
</html>
Reload the root URL of your site at localhost:5000.
Loop through the CSV data and format it as a GeoJSON object, which Leaflet can easily load.
<!doctype html>
<!doctype html>
<html lang="en">
<head>
    <link rel="stylesheet" href="https://unpkg.com/leaflet@1.9.3/dist/leaflet.css"
    integrity="sha256-kLaT2GOSpHechhsozzB+flnD+zUyjE2LlfWPgU04xyI="
    crossorigin=""/>
    <script src="https://unpkg.com/leaflet@1.9.3/dist/leaflet.js"
 integrity="sha256-WBkoXOwTeyKclOHuWtc+i2uENFpDZ9YPdf5Hf+D7ewM="
 crossorigin=""></script>
</head>
<body>
    <div id="map" style="width:100%; height:300px;"></div>
    <h1>Baltimore 911 Overdose Calls</h1>
    <table border=1 cellpadding=7>
        <tr>
            <th>Call Number</th>
            <th>Date</th>
            <th>Time</th>
            <th>Location</th>
            <th>Neighborhood</th>
        </tr>
        {% for obj in object_list %}
        <tr>
            <td><a href="{{ obj.callNumber }}/">{{ obj.callNumber }}</a></td>
            <td>{{ obj.date }}</td>
            <td>{{ obj.time }}</td>
            <td>{{ obj.location }}</td>
            <td>{{ obj.Neighborhood }}</td>
        </tr>
        {% endfor %}
    </table>
        <script type="text/javascript">
            var map = L.map('map').setView([39.3, -76.5], 11);
            var osmLayer = new L.TileLayer('https://{s}.tile.openstreetmap.org/{z}/{x}/{y}.png', {
                maxZoom: 18,
                attribution: 'Data, imagery and map information provided by <a href="https://www.openstreetmap.org/" target="_blank">OpenStreetMap</a>.'
            });
            map.addLayer(osmLayer);
            var data = [
            {% for obj in object_list %}
            {
              "type": "Feature",
              "properties": {
                "full_name": "{{ obj.location }}",
                "id": "{{ obj.callNumber }}",
                "popupContent": "{{ obj.incidentLocation }}",
                "show_on_map": true
              },
              "geometry": {
                "type": "Point",
                "coordinates": [{{ obj.lng }}, {{ obj.lat }}]
              }
            }{% if not loop.last %},{% endif %}
            {% endfor %}
          ];
            var dataLayer = L.geoJson(data);
            map.addLayer(dataLayer);
        </script>
    </body>
</html>
Reload the page.
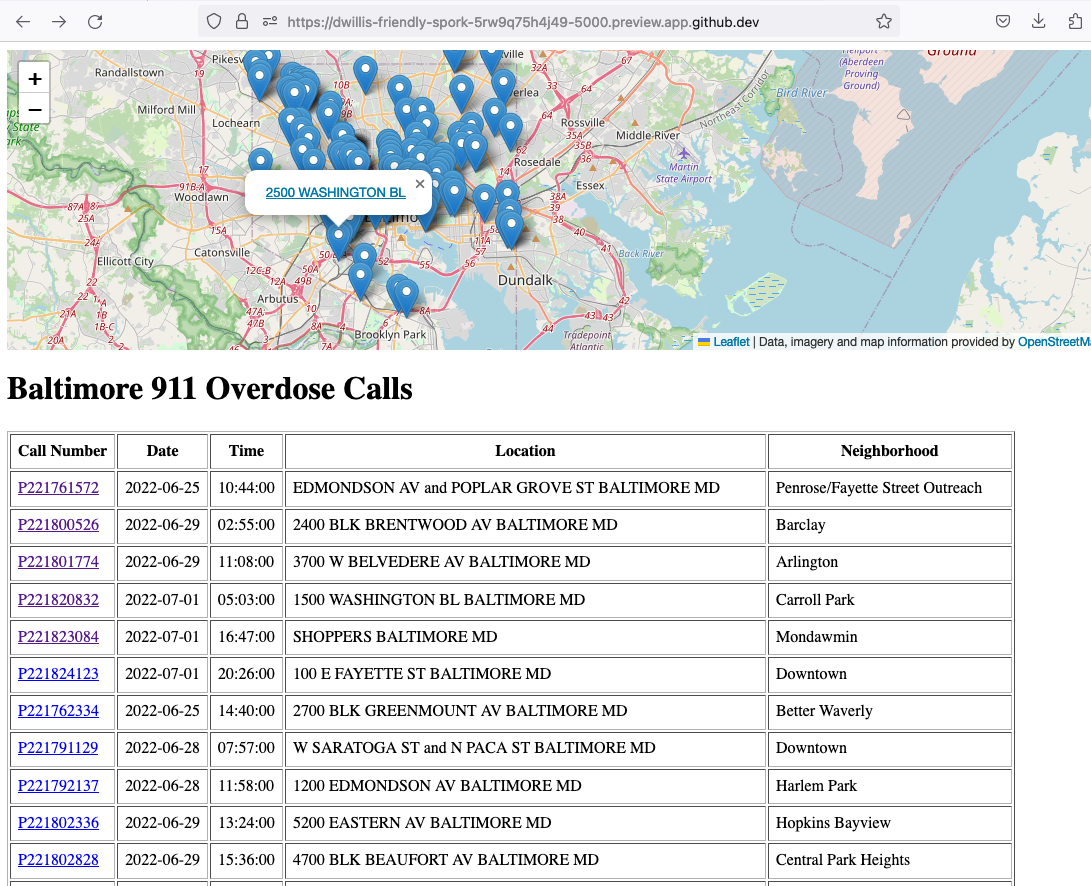
Add a popup on the map pins that shows the location of the call.
<!doctype html>
<html lang="en">
    <head>
    <link rel="stylesheet" href="https://unpkg.com/leaflet@1.9.3/dist/leaflet.css"
    integrity="sha256-kLaT2GOSpHechhsozzB+flnD+zUyjE2LlfWPgU04xyI="
    crossorigin=""/>
    <script src="https://unpkg.com/leaflet@1.9.3/dist/leaflet.js"
 integrity="sha256-WBkoXOwTeyKclOHuWtc+i2uENFpDZ9YPdf5Hf+D7ewM="
 crossorigin=""></script>
    </head>
    <body>
        <div id="map" style="width:100%; height:300px;"></div>
        <h1>One Week of Baltimore 911 Overdose Calls</h1>
        <table border=1 cellpadding=7>
            <tr>
                <th>Call Number</th>
                <th>Date</th>
                <th>Time</th>
                <th>Location</th>
                <th>Neighborhood</th>
            </tr>
            {% for obj in object_list %}
            <tr>
                <td><a href="{{ obj.callNumber }}/">{{ obj.callNumber }}</a></td>
                <td>{{ obj.date }}</td>
                <td>{{ obj.time }}</td>
                <td>{{ obj.location }}</td>
                <td>{{ obj.Neighborhood }}</td>
            </tr>
            {% endfor %}
        </table>
        <script type="text/javascript">
            var map = L.map('map').setView([39.3, -76.5], 11);
            var osmLayer = new L.TileLayer('https://{s}.tile.openstreetmap.org/{z}/{x}/{y}.png', {
                maxZoom: 18,
                attribution: 'Data, imagery and map information provided by <a href="https://www.openstreetmap.org/" target="_blank">OpenStreetMap</a> and contributors.'
            });
            map.addLayer(osmLayer);
            var data = {
              "type": "FeatureCollection",
              "features": [
                {% for obj in object_list %}
                {
                  "type": "Feature",
                  "properties": {
                    "full_name": "{{ obj.location }}",
                    "id": "{{ obj.callNumber }}"
                  },
                  "geometry": {
                    "type": "Point",
                    "coordinates": [{{ obj.lng }}, {{ obj.lat }}]
                  }
                }{% if not loop.last %},{% endif %}
                {% endfor %}
              ]
            };
            var dataLayer = L.geoJson(data, {
                onEachFeature: function(feature, layer) {
                    layer.bindPopup(feature.properties.full_name);
                }
            });
            map.addLayer(dataLayer);
        </script>
    </body>
</html>
Reload the page and click a pin.
Now wrap the name in a hyperlink to that person’s detail page.
<!doctype html>
<html lang="en">
<head>
    <link rel="stylesheet" href="https://unpkg.com/leaflet@1.9.3/dist/leaflet.css" integrity="sha256-kLaT2GOSpHechhsozzB+flnD+zUyjE2LlfWPgU04xyI=" crossorigin=""/>
    <script src="https://unpkg.com/leaflet@1.9.3/dist/leaflet.js" integrity="sha256-WBkoXOwTeyKclOHuWtc+i2uENFpDZ9YPdf5Hf+D7ewM=" crossorigin=""></script>
</head>
<body>
    <div id="map" style="width:100%; height:300px;"></div>
    <h1>Baltimore 911 Overdose Calls</h1>
    <table border=1 cellpadding=7>
        <tr>
            <th>Call Number</th>
            <th>Date</th>
            <th>Time</th>
            <th>Location</th>
            <th>Neighborhood</th>
        </tr>
        {% for obj in object_list %}
        <tr>
            <td><a href="{{ obj.callNumber }}/">{{ obj.callNumber }}</a></td>
            <td>{{ obj.date }}</td>
            <td>{{ obj.time }}</td>
            <td>{{ obj.location }}</td>
            <td>{{ obj.Neighborhood }}</td>
        </tr>
        {% endfor %}
    </table>
    <script type="text/javascript">
        var map = L.map('map').setView([39.3, -76.5], 11);
        var osmLayer = new L.TileLayer('https://{s}.tile.openstreetmap.org/{z}/{x}/{y}.png', {
            maxZoom: 18,
            attribution: 'Data, imagery and map information provided by <a href="https://www.openstreetmap.org/" target="_blank">OpenStreetMap</a>.'
        });
        map.addLayer(osmLayer);
        function onEachFeature(feature, layer) {
            // does this feature have a property named popupContent?
            if (feature.properties && feature.properties.popupContent) {
                layer.bindPopup('<a href="'+ feature.properties.id + '/">' + feature.properties.popupContent + '</a>');
            }
        }
        var data = [
            {% for obj in object_list %}
            {
              "type": "Feature",
              "properties": {
                "full_name": "{{ obj.location }}",
                "id": "{{ obj.callNumber }}",
                "popupContent": "{{ obj.incidentLocation }}",
                "show_on_map": true
              },
              "geometry": {
                "type": "Point",
                "coordinates": [{{ obj.lng }}, {{ obj.lat }}]
              }
            }{% if not loop.last %},{% endif %}
            {% endfor %}
          ];
        L.geoJSON(data, {
            onEachFeature: onEachFeature
        }).addTo(map);
        </script>
    </body>
</html>
Reload again and click a pin.
Commit your map.
$ git add .
$ git commit -m "Made a map on the index page"
$ git push origin main
Act 5: Hello Internet
In this final act, we will publish your application to the Internet using Frozen Flask, a Python library that saves every page you’ve made with Flask as a flat file that can be uploaded to the web. This is an alternative publishing method that does not require you configure and host an full-fledged Internet server.
First, use pip to install Frozen Flask from the command line.
$ pip install Frozen-Flask
Create a new file called freeze.py where we will configure which pages it should convert into flat files.
# in the terminal:
$ touch freeze.py
Use your text editor to write a basic Frozen Flask configuration.
from flask_frozen import Freezer
from app import app
freezer = Freezer(app)

if __name__ == '__main__':
    freezer.freeze()
Now run it from the command line, which will create a new directory called build filled with a set of flattened files.
$ python freeze.py
Use your browser to open up one of the local files in build, rather that visit the dynamically generated pages we created at localhost.
You will notice that the default Frozen Flask configuration only flattened out index.html, and not all your detail pages our template could generate using the data file.
To flatten those, again edit freeze.py to give it the instructions it needs to make a page for every record in the source CSV.
from flask_frozen import Freezer
from app import app, get_csv
freezer = Freezer(app)

@freezer.register_generator
def detail():
    for row in get_csv():
        yield {'call_number': row['callNumber']}

if __name__ == '__main__':
    freezer.freeze()
Run it again from the command line and notice all the additional pages it made in the build directory. Try opening one in your browser.
$ python freeze.py
Commit all of the flat pages to the repository.
$ git add .
$ git commit -m "Froze my app"
$ git push origin main
Finally, we will publish these static files to the web using GitHub’s Pages feature. All it requires is that we create a new branch in our repository called gh-pages and push our files up to GitHub there.
$ git checkout -b gh-pages # Create the new branch
$ git merge main # Pull in all the code from the master branch
$ git push origin gh-pages # Push up to GitHub from your new branch
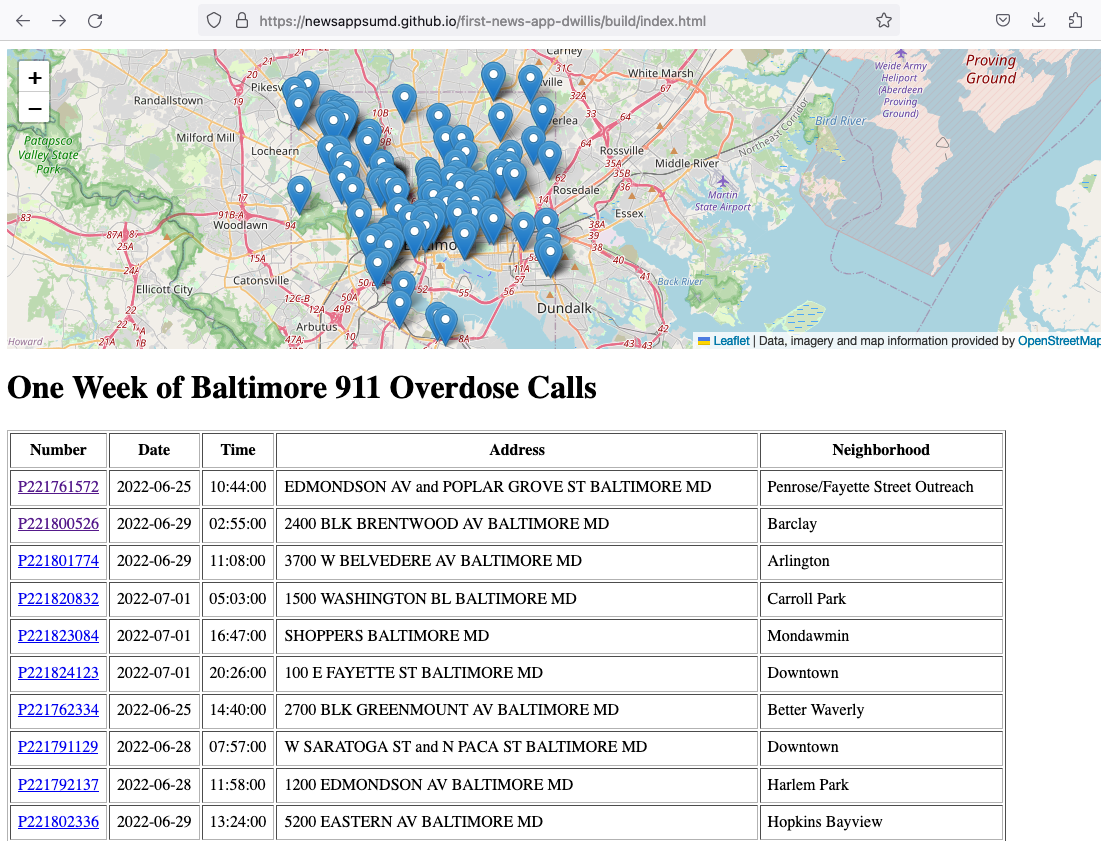
Now wait a minute or two, then visit https://newsappsumd.github.io/first-news-app-<yourusername>/build/index.html to cross the finish line.
Note
If your page does not appear, make sure that you have verified your email address with GitHub. It is required before the site will allow publishing pages. And keep in mind there are many other options for publishing flat files, like Amazon’s S3 service.
So you’ve built a site. But it’s kind of janky looking. The next chapter will show you how to dress it up to look like the demonstration site.
Epilogue: Hello CSS
Before you get started, move back to the master branch of your repository.
$ git checkout master
The first step is to create a stylesheet in the static directory where CSS code that controls the design of the page can be stored.
# in the terminal:
$ touch static/style.css
Add the style tag to the top of index.html so it imported on the page. Flask’s built-in url_for
method will create the URL for us.
<!doctype html>
<html lang="en">
    <head>
        <link rel="stylesheet" href="{{ url_for('static', filename='style.css') }}" />
        <link rel="stylesheet" href="https://unpkg.com/leaflet@1.9.3/dist/leaflet.css" integrity="sha256-kLaT2GOSpHechhsozzB+flnD+zUyjE2LlfWPgU04xyI=" crossorigin=""/>
        <script src="https://unpkg.com/leaflet@1.9.3/dist/leaflet.js" integrity="sha256-WBkoXOwTeyKclOHuWtc+i2uENFpDZ9YPdf5Hf+D7ewM=" crossorigin=""></script>
    </head>
    <body>
        <div id="map" style="width:100%; height:300px;"></div>
        <h1>Baltimore 911 Overdose Calls</h1>
        <table border=1 cellpadding=7>
            <tr>
                <th>Call Number</th>
                <th>Date</th>
                <th>Time</th>
                <th>Location</th>
                <th>Neighborhood</th>
            </tr>
            {% for obj in object_list %}
            <tr>
                <td><a href="{{ obj.callNumber }}/">{{ obj.callNumber }}</a></td>
                <td>{{ obj.date }}</td>
                <td>{{ obj.time }}</td>
                <td>{{ obj.location }}</td>
                <td>{{ obj.Neighborhood }}</td>
            </tr>
            {% endfor %}
        </table>
        <script type="text/javascript">
            var map = L.map('map').setView([39.3, -76.5], 11);
            var osmLayer = new L.TileLayer('https://{s}.tile.openstreetmap.org/{z}/{x}/{y}.png', {
                maxZoom: 18,
                attribution: 'Data, imagery and map information provided by <a href="https://www.openstreetmap.org/" target="_blank">OpenStreetMap</a>.'
            });
            map.addLayer(osmLayer);
            function onEachFeature(feature, layer) {
                // does this feature have a property named popupContent?
                if (feature.properties && feature.properties.popupContent) {
                    layer.bindPopup('<a href="'+ feature.properties.id + '/">' + feature.properties.popupContent + '</a>');
                }
            }
            var data = [
                {% for obj in object_list %}
                {
                  "type": "Feature",
                  "properties": {
                    "full_name": "{{ obj.location }}",
                    "id": "{{ obj.callNumber }}",
                    "popupContent": "{{ obj.incidentLocation }}",
                    "show_on_map": true
                  },
                  "geometry": {
                    "type": "Point",
                    "coordinates": [{{ obj.lng }}, {{ obj.lat }}]
                  }
                }{% if not loop.last %},{% endif %}
                {% endfor %}
              ];
            L.geoJSON(data, {
                onEachFeature: onEachFeature
            }).addTo(map);
        </script>
    </body>
</html>
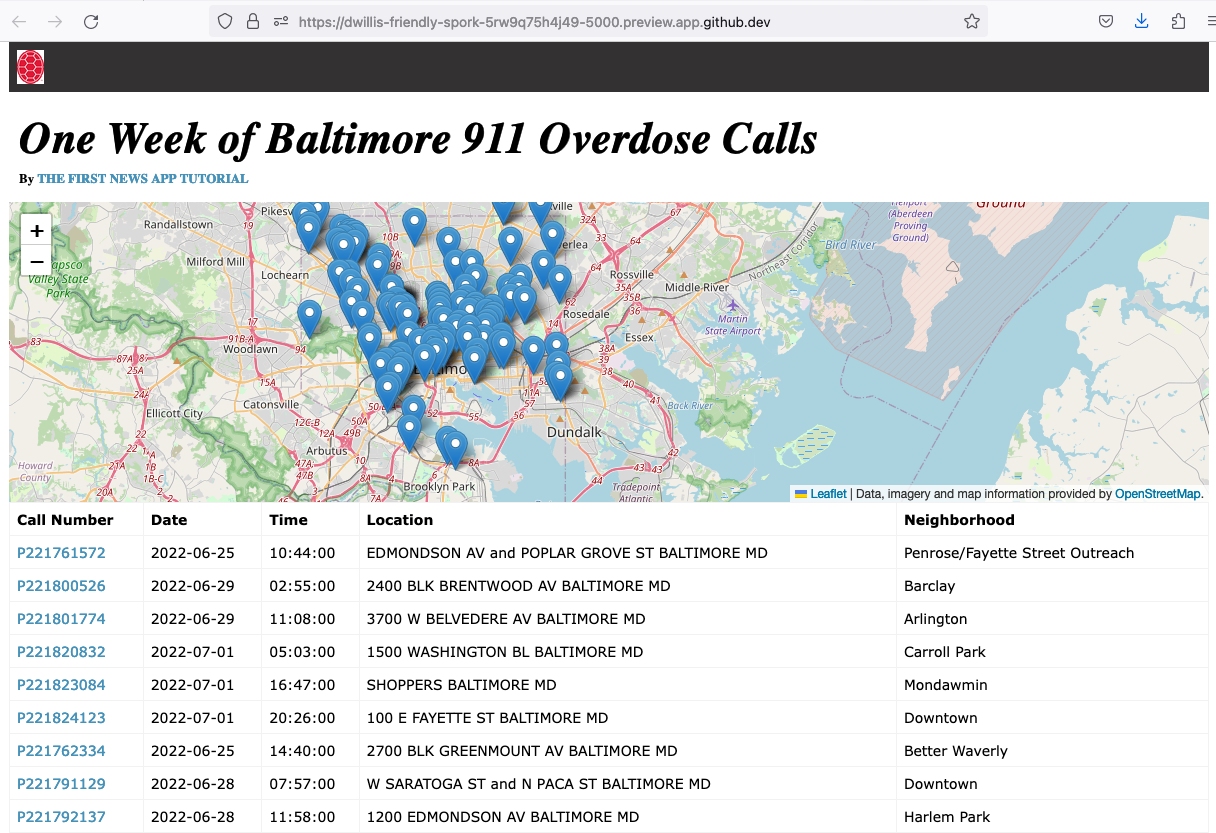
Before we start styling the page, let’s do a little reorganization of the HTML to make a little more like a news site.
First, download this UMD logo
and throw in the static directory. We’ll add that as an image in a new
navigation bar at the top of the site, then zip up the headline and move it above the map with
with a new byline.
<!doctype html>
<html lang="en">
<head>
    <link rel="stylesheet" href="{{ url_for('static', filename='style.css') }}" />
    <link rel="stylesheet" href="https://unpkg.com/leaflet@1.9.3/dist/leaflet.css"
    integrity="sha256-kLaT2GOSpHechhsozzB+flnD+zUyjE2LlfWPgU04xyI="
    crossorigin=""/>
    <script src="https://unpkg.com/leaflet@1.9.3/dist/leaflet.js"
 integrity="sha256-WBkoXOwTeyKclOHuWtc+i2uENFpDZ9YPdf5Hf+D7ewM="
 crossorigin=""></script>
</head>
<body>
    <nav>
        <a href="https://first-news-app-umd.readthedocs.org/">
            <img src="{{ url_for('static', filename='shell.png') }}">
        </a>
    </nav>
    <header>
        <h1>One Week of Baltimore 911 Overdose Calls</h1>
            <div class="byline">
                By <a href="https://first-news-app-umd.readthedocs.org/">The First News App Tutorial</a>
            </div>
        </header>
    <div id="map" style="width:100%; height:300px;"></div>
    <table border=1 cellpadding=7>
        <tr>
            <th>Call Number</th>
            <th>Date</th>
            <th>Time</th>
            <th>Location</th>
            <th>Neighborhood</th>
        </tr>
        {% for obj in object_list %}
        <tr>
            <td><a href="{{ obj.callNumber }}/">{{ obj.callNumber }}</a></td>
            <td>{{ obj.date }}</td>
            <td>{{ obj.time }}</td>
            <td>{{ obj.location }}</td>
            <td>{{ obj.Neighborhood }}</td>
        </tr>
        {% endfor %}
    </table>
    <script type="text/javascript">
        var map = L.map('map').setView([39.3, -76.5], 11);
        var osmLayer = new L.TileLayer('https://{s}.tile.openstreetmap.org/{z}/{x}/{y}.png', {
            maxZoom: 18,
            attribution: 'Data, imagery and map information provided by <a href="https://www.openstreetmap.org/" target="_blank">OpenStreetMap</a>.'
        });
        map.addLayer(osmLayer);
        function onEachFeature(feature, layer) {
            // does this feature have a property named popupContent?
            if (feature.properties && feature.properties.popupContent) {
                layer.bindPopup('<a href="'+ feature.properties.id + '/">' + feature.properties.popupContent + '</a>');
            }
        }
        var data = [
            {% for obj in object_list %}
            {
              "type": "Feature",
              "properties": {
                "full_name": "{{ obj.location }}",
                "id": "{{ obj.callNumber }}",
                "popupContent": "{{ obj.incidentLocation }}",
                "show_on_map": true
              },
              "geometry": {
                "type": "Point",
                "coordinates": [{{ obj.lng }}, {{ obj.lat }}]
              }
            }{% if not loop.last %},{% endif %}
            {% endfor %}
          ];
        L.geoJSON(data, {
            onEachFeature: onEachFeature
        }).addTo(map);
        </script>
    </body>
</html>
Now go into style.css and toss in some style we’ve prepared that will
draw in a dark top bar, limit the width of the page and tighten up the rest
of the page.
body {
    margin: 0 auto;
    padding: 0;
    font-family: Verdana, sans-serif;
    background-color: ##F2EFEC;
    max-width: 1200px;
}
nav {
    background-color: #333132;
    width: 100%;
    height: 50px;
}
nav img {
    height: 34px;
    padding: 8px;
}
header {
    margin: 25px 10px 15px 10px;
    font-family: Times, Times New Roman, serif;
}
h1 {
    margin: 0;
    padding: 0;
    font-size: 44px;
    line-height: 50px;
    font-weight: bold;
    font-style: italic;
    text-shadow: 0.3px 0.3px 0px gray;
    letter-spacing: .01em;
}
.byline {
    margin: 6px 0 0 0;
    font-size: 13px;
    font-weight: bold;
}
.byline a {
    text-transform: uppercase;
}
table {
    border-collapse:collapse;
    margin: 0 0 20px 0;
    border-width: 0;
    width: 100%;
    font-size: 14px;
}
th {
    text-align:left;
}
tr, td, th {
    border-color: #f2f2f2;
}
tr:hover {
    background-color: #f3f3f3;
}
p {
    line-height:140%;
}
a {
    color: #4591B8;
    text-decoration: none;
}
a:hover {
    text-decoration: underline;
}
Reload the page and you should see something a little more presentable.
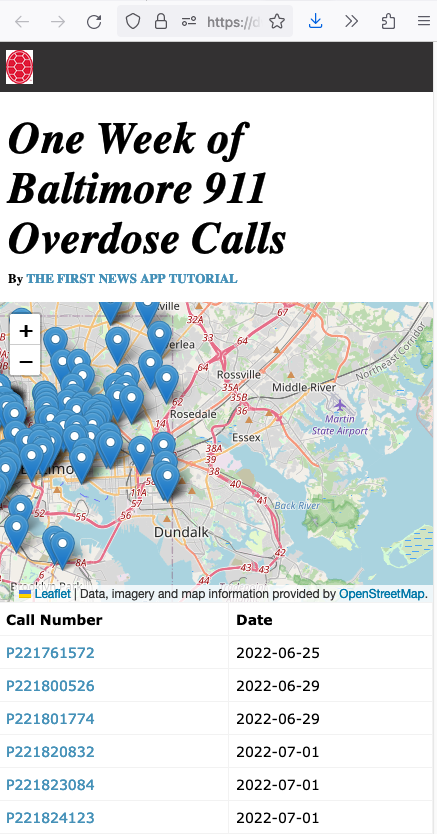
The next step is to upgrade the styles to reshape the page on smaller devices like tablets and phones. This is done using a system known as responsive design and CSS media queries that set different style rules at different device sizes.
First the HTML page needs an extra tag to turn the system on.
<!doctype html>
<html lang="en">
<head>
    <meta name="viewport" content="width=device-width, initial-scale=1.0">
    <link rel="stylesheet" href="{{ url_for('static', filename='style.css') }}" />
    <link rel="stylesheet" href="https://unpkg.com/leaflet@1.9.3/dist/leaflet.css" integrity="sha256-kLaT2GOSpHechhsozzB+flnD+zUyjE2LlfWPgU04xyI=" crossorigin=""/>
    <script src="https://unpkg.com/leaflet@1.9.3/dist/leaflet.js" integrity="sha256-WBkoXOwTeyKclOHuWtc+i2uENFpDZ9YPdf5Hf+D7ewM=" crossorigin=""></script>
</head>
<body>
    <nav>
        <a href="https://first-news-app-umd.readthedocs.org/">
            <img src="{{ url_for('static', filename='shell.png') }}">
        </a>
    </nav>
    <header>
        <h1>One Week of Baltimore 911 Overdose Calls</h1>
            <div class="byline">
                By <a href="https://first-news-app-umd.readthedocs.org/">The First News App Tutorial</a>
            </div>
        </header>
    <div id="map" style="width:100%; height:300px;"></div>
    <table border=1 cellpadding=7>
        <tr>
            <th>Call Number</th>
            <th>Date</th>
            <th>Time</th>
            <th>Location</th>
            <th>Neighborhood</th>
        </tr>
        {% for obj in object_list %}
        <tr>
            <td><a href="{{ obj.callNumber }}/">{{ obj.callNumber }}</a></td>
            <td>{{ obj.date }}</td>
            <td>{{ obj.time }}</td>
            <td>{{ obj.location }}</td>
            <td>{{ obj.Neighborhood }}</td>
        </tr>
        {% endfor %}
    </table>
    <script type="text/javascript">
        var map = L.map('map').setView([39.3, -76.5], 11);
        var osmLayer = new L.TileLayer('https://{s}.tile.openstreetmap.org/{z}/{x}/{y}.png', {
            maxZoom: 18,
            attribution: 'Data, imagery and map information provided by <a href="https://www.openstreetmap.org/" target="_blank">OpenStreetMap</a>.'
        });
        map.addLayer(osmLayer);
        function onEachFeature(feature, layer) {
            // does this feature have a property named popupContent?
            if (feature.properties && feature.properties.popupContent) {
                layer.bindPopup('<a href="'+ feature.properties.id + '/">' + feature.properties.popupContent + '</a>');
            }
        }
        var data = [
            {% for obj in object_list %}
            {
              "type": "Feature",
              "properties": {
                "full_name": "{{ obj.location }}",
                "id": "{{ obj.callNumber }}",
                "popupContent": "{{ obj.incidentLocation }}",
                "show_on_map": true
              },
              "geometry": {
                "type": "Point",
                "coordinates": [{{ obj.lng }}, {{ obj.lat }}]
              }
            }{% if not loop.last %},{% endif %}
            {% endfor %}
          ];
        L.geoJSON(data, {
            onEachFeature: onEachFeature
        }).addTo(map);
        </script>
    </body>
</html>
Now the style.css file should be expanded to include media queries
that will drop columns from the table on smaller devices.
body {
    margin: 0 auto;
    padding: 0;
    font-family: Verdana, sans-serif;
    background-color: ##F2EFEC;
    max-width: 1200px;
}
nav {
    background-color: #333132;
    width: 100%;
    height: 50px;
}
nav img {
    height: 34px;
    padding: 8px;
}
header {
    margin: 25px 10px 15px 10px;
    font-family: Times, Times New Roman, serif;
}
h1 {
    margin: 0;
    padding: 0;
    font-size: 44px;
    line-height: 50px;
    font-weight: bold;
    font-style: italic;
    text-shadow: 0.3px 0.3px 0px gray;
    letter-spacing: .01em;
}
.byline {
    margin: 6px 0 0 0;
    font-size: 13px;
    font-weight: bold;
}
.byline a {
    text-transform: uppercase;
}
table {
    border-collapse:collapse;
    margin: 0 0 20px 0;
    border-width: 0;
    width: 100%;
    font-size: 14px;
}
th {
    text-align:left;
}
tr, td, th {
    border-color: #f2f2f2;
}
tr:hover {
    background-color: #f3f3f3;
}
p {
    line-height:140%;
}
a {
    color: #4591B8;
    text-decoration: none;
}
a:hover {
    text-decoration: underline;
}
@media (max-width: 979px) {
    tr th:nth-of-type(n+3),
    tr td:nth-of-type(n+3) {
        display:none;
    }
}
@media (max-width: 420px) {
    tr th:nth-of-type(n+2),
    tr td:nth-of-type(n+2) {
        display:none;
    }
}
Reload the page and size down your browser to see how the page should appear when visited by a mobile phone.
We can punch up the map markers by replacing the Leaflet default pins with custom designs from the Mapbox’s open-source Maki set.
Download these two
black pin images and add them to your static directory.
Now expand our Leaflet JavaScript code to substitute these images for the defaults.
<!doctype html>
<html lang="en">
<head>
    <meta name="viewport" content="width=device-width, initial-scale=1.0">
    <link rel="stylesheet" href="{{ url_for('static', filename='style.css') }}" />
    <link rel="stylesheet" href="https://unpkg.com/leaflet@1.9.3/dist/leaflet.css" integrity="sha256-kLaT2GOSpHechhsozzB+flnD+zUyjE2LlfWPgU04xyI=" crossorigin=""/>
    <script src="https://unpkg.com/leaflet@1.9.3/dist/leaflet.js" integrity="sha256-WBkoXOwTeyKclOHuWtc+i2uENFpDZ9YPdf5Hf+D7ewM=" crossorigin=""></script>
</head>
<body>
    <nav>
        <a href="https://first-news-app-umd.readthedocs.org/">
            <img src="{{ url_for('static', filename='shell.png') }}">
        </a>
    </nav>
    <header>
        <h1>One Week of Baltimore 911 Overdose Calls</h1>
            <div class="byline">
                By <a href="https://first-news-app-umd.readthedocs.org/">The First News App Tutorial</a>
            </div>
        </header>
    <div id="map" style="width:100%; height:300px;"></div>
    <table border=1 cellpadding=7>
        <tr>
            <th>Call Number</th>
            <th>Date</th>
            <th>Time</th>
            <th>Location</th>
            <th>Neighborhood</th>
        </tr>
        {% for obj in object_list %}
        <tr>
            <td><a href="{{ obj.callNumber }}/">{{ obj.callNumber }}</a></td>
            <td>{{ obj.date }}</td>
            <td>{{ obj.time }}</td>
            <td>{{ obj.location }}</td>
            <td>{{ obj.Neighborhood }}</td>
        </tr>
        {% endfor %}
    </table>
    <script type="text/javascript">
        var map = L.map('map').setView([39.3, -76.5], 11);
        var osmLayer = new L.TileLayer('https://{s}.tile.openstreetmap.org/{z}/{x}/{y}.png', {
            maxZoom: 18,
            attribution: 'Data, imagery and map information provided by <a href="https://www.openstreetmap.org/" target="_blank">OpenStreetMap</a>.'
        });
        map.addLayer(osmLayer);
        function onEachFeature(feature, layer) {
            // does this feature have a property named popupContent?
            if (feature.properties && feature.properties.popupContent) {
                layer.bindPopup('<a href="'+ feature.properties.id + '/">' + feature.properties.popupContent + '</a>');
            }
        }
        var data = [
            {% for obj in object_list %}
            {
              "type": "Feature",
              "properties": {
                "full_name": "{{ obj.location }}",
                "id": "{{ obj.callNumber }}",
                "popupContent": "{{ obj.incidentLocation }}",
                "show_on_map": true
              },
              "geometry": {
                "type": "Point",
                "coordinates": [{{ obj.lng }}, {{ obj.lat }}]
              }
            }{% if not loop.last %},{% endif %}
            {% endfor %}
          ];
            var blackIcon = L.Icon.extend({
                options: {
                    iconUrl: "{{ url_for('static', filename='marker-24.png') }}",
                    iconSize: [24, 24]
                }
            });
            L.geoJSON(data, {
                pointToLayer: function (feature, latlng) {
                    return L.marker(latlng, {icon: new blackIcon()});
                },
                onEachFeature: onEachFeature
            }).addTo(map);
        </script>
    </body>
</html>
That will restyle the map to look like this.
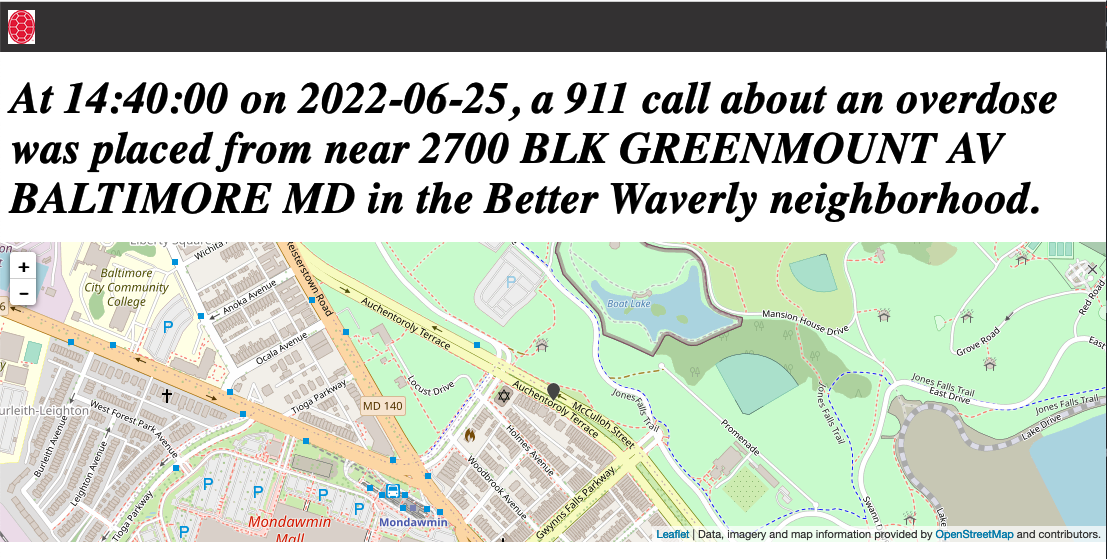
Extending this new design to detail page is simply a matter of repeating the steps above.
<!doctype html>
<html lang="en">
    <head>
        <meta name="viewport" content="width=device-width, initial-scale=1.0">
        <link rel="stylesheet" href="{{ url_for('static', filename='style.css') }}" />
        <link rel="stylesheet" href="https://cdnjs.cloudflare.com/ajax/libs/leaflet/0.7.7/leaflet.css" />
        <script src="https://cdnjs.cloudflare.com/ajax/libs/leaflet/0.7.7/leaflet.js"></script>
    </head>
    <body>
        <nav>
            <a href="https://first-news-app-umd.readthedocs.org/">
                <img src="{{ url_for('static', filename='shell.png') }}">
            </a>
        </nav>
        <header>
            <h1>
                At {{ object.time }} on {{ object.date }}, a 911 call about an overdose was placed from near
                {{ object.location }} in the {{ object.Neighborhood }} neighborhood.
            </h1>
        </header>
        <div id="map" style="width:100%; height:300px;"></div>
        <script type="text/javascript">
            var map = L.map('map').setView([{{ object.lat }}, {{ object.lng }}], 16);
            var osmLayer = new L.TileLayer('https://{s}.tile.openstreetmap.org/{z}/{x}/{y}.png', {
                maxZoom: 18,
                attribution: 'Data, imagery and map information provided by <a href="https://www.openstreetmap.org/" target="_blank">OpenStreetMap</a> and contributors.'
            });
            map.addLayer(osmLayer);
            var blackIcon = L.Icon.extend({
                options: {
                    iconUrl: "{{ url_for('static', filename='marker-24.png') }}",
                    iconSize: [24, 24]
                }
            });
            var marker = L.marker([{{ object.lat }}, {{ object.lng }}], {icon: new blackIcon()}).addTo(map);
        </script>
    </body>
</html>
That should shape up the page like this.
Now it is time to build out all the pages by running the freeze script that will save all of the pages again. Before you do that, though, we have one change to make to our app.py file to ensure that the published version picks up our static files correctly. Add one line to your file:
import csv
from flask import Flask
from flask import abort
from flask import render_template
app = Flask(__name__)
app.config['FREEZER_RELATIVE_URLS'] = True
Then re-run the freeze.py script to save all of the pages again.
$ python freeze.py
Commit all of the flat pages to the repository.
$ git add .
$ git commit -m "Froze my restyled app"
$ git push origin main
Republish your work by going back to the gh-pages branch and pushing up the code.
$ git checkout gh-pages
$ git merge main
$ git push origin gh-pages
Now wait a minute or two, then visit https://newsappsumd.github.io/first-news-app-<yourusername>/build/index.html to see
the restyled application.